TI-series graphing calculators are powerful tools that can greatly aid students in visualizing and analyzing mathematical functions. Whether you’re exploring basic algebraic equations or diving into complex trigonometric functions, harnessing the power of your calculator can enhance your understanding and proficiency in mathematics. In this guide, I’ll walk you through the steps to effectively graph and analyze functions using your graphing calculator.
Getting Started
Press the “Y=” button and enter the function you’d like to graph. Be sure to follow the correct order of operations as you do so. You can enter as many functions as you’d like, each in its own row. Then hit “GRAPH” to display the function(s) on the xy-coordinate plane.
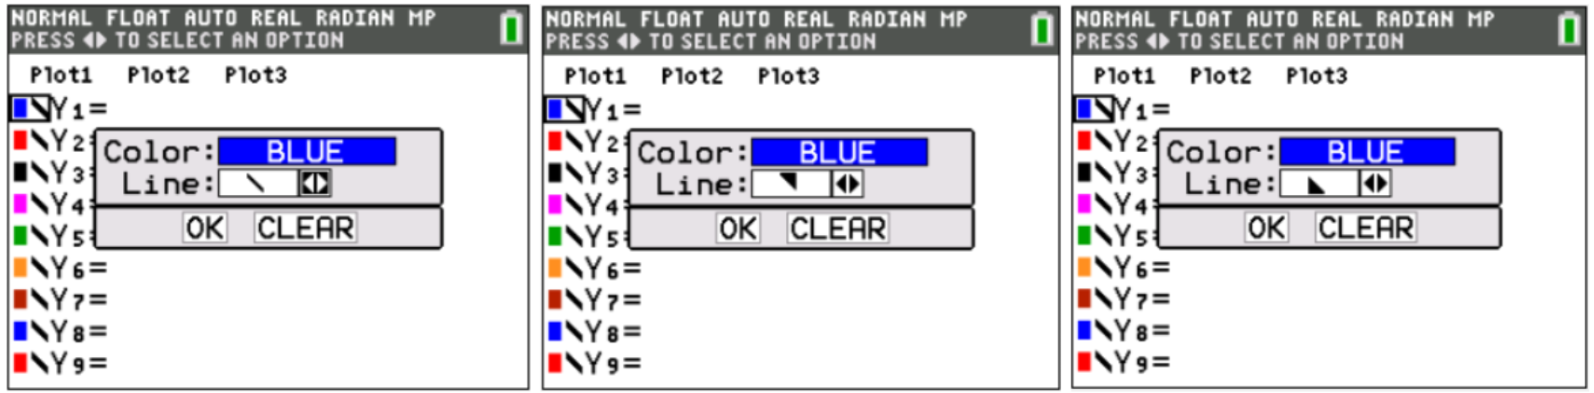
You can also graph inequalities of functions by moving your calculator’s cursor to the left, over the colored box and what looks like a slash (but is actually the chosen Line mode), then pressing ENTER. From this window, you can change the Line input from its default (below, left) to shade above (below, center) or below (below, right) the points on the line or curve.
Here’s what each of these options looks like when I enter and graph the same function as an equation (line) or inequality (shading above or below) using each of these settings:
Evaluating Functions
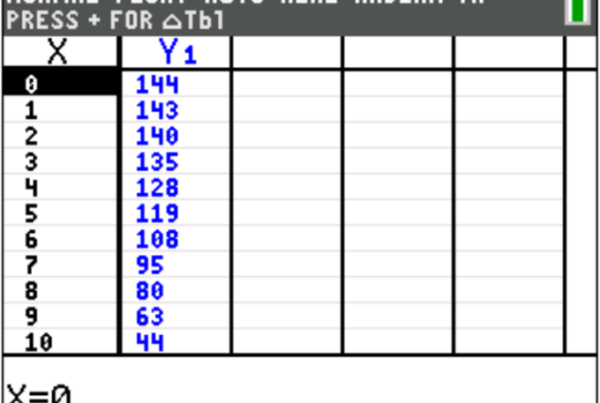
Many of my students are familiar with the TRACE function, which allows you to use the left and right arrow keys to move in either direction along the points on the graph. This can definitely be a useful feature, but I find the default trace interval particularly awkward, so let’s start by showing you how to change it. Press the WINDOW key, then scroll down to TraceStep and enter the x-interval you’d like the cursor to move each time you press the left or right arrow key.
Instead of tracing along the graph of a function, we can calculate values on a graph at specific points by pressing 2ND→TRACE (CALC) and choosing “value”. Type in the x-value you want to evaluate the function at, press ENTER, and your calculator will compute the value of the function for you:
Calculating Other Points of Interest
There are several other useful features under the CALC menu. If we want to calculate the x-intercepts on a graph (or its zeros), we can open the CALC menu and choose “zero”. The calculator prompts us to enter the following information:
- Left bound: This is basically the calculator asking you where on the graph to start looking for a value of the function that is equal to zero. Move your cursor to a point that is definitely to the left of the x-intercept on the graph, then press ENTER.
- Right bound: Same as above, but where to stop looking (or for a point on the graph that is definitely to the right of the x-intercept).
- Guess: This is the calculator asking you to estimate the coordinates of the x-intercept. Notice that in the example below, there are actually two x-intercepts between the bounds I have chosen, so I need to tell the calculator which one to identify (I went for the right of the two). Then press ENTER to calculate the exact value.
If you’re looking to calculate the maximum or minimum value of a function on a given interval, you can also do so by choosing the respective options in the CALC menu. Fortunately, they follow the same steps as calculating an x-intercept.
Using Graphs to Solve Systems of Equations or Inequalities
Finally, we can use the “intersect” function under the CALC menu to calculate a point at which two functions intersect. Follow the same steps from above to graph both functions, choose this option from the CALC menu, and input the following information:
- First curve: Choose the first function of the two that intersect with the up or down arrow keys. In the example below, I’ve only graphed two functions, so I only need to press ENTER. Notice that the selected function is indicated above the top left corner of the graph.
- Second curve: Choose the second function of the two that intersect. Again, in this example, the calculator automatically switches to the only other function on the graph, so all I need to do is press ENTER again.
- Guess: Move the cursor close enough to the point of intersection you want to calculate for the calculator to distinguish between multiple points of intersection. In my example below, this is particularly important in order to choose which of the three points of intersection I want the calculator to identify.
If, instead, this were a system of inequalities, we could shade above or below the curves as necessary to find all the points in the shaded regions of both functions. It might look something like this, where our solutions would be found where the shaded regions overlap:
Conclusion
Mastering function graphing and analysis using your graphing calculator is a valuable skill that can greatly enhance your mathematical abilities. By following the steps outlined in this guide, you’ll be equipped to graph complex functions, analyze their properties, and quickly navigate to tools you can use to calculate additional features for deeper insights. Whether you’re a student or educator, your graphing calculator can serve as an invaluable tool for exploring the intricacies of mathematical functions and achieving success in your mathematical endeavors.
Matt Madsen
Interested in learning more about Test Prep at Mindfish?
Contact us today to find out what our dedicated tutors can help you achieve.