
TI-series graphing calculators have been a staple tool for students and educators alike for decades, providing the ability to visualize mathematical functions quickly and accurately. In Part 5 of the Calculator Mastery Series, I demonstrated the steps necessary to graph, evaluate, and analyze functions using a TI-series graphing calculator. Additionally, mastering the intricacies of manipulating graphs and utilizing features like the Table can further enhance your understanding and efficiency. In this blog post, I’ll walk you through the steps involved in manipulating the window of a graph and utilizing the Table feature effectively.
Manipulating the Window of a Graph
If the graph of a function does not appear as expected or is not visible, you likely need to adjust the Window settings:
- Press the WINDOW button to access the window settings menu. Here, you can set the x and y-axis ranges to focus on the region of interest.
- Adjust the “Xmin,” “Xmax,” “Ymin,” and “Ymax” values to change the range of values shown on the graph.
- Use the arrow keys to move the cursor between values and the numeric keypad to input new values.
For example, the function I’ve graphed below doesn’t fit in the default window. By Tracing the function, I can get a sense of some points on the graph and how to adjust the Window so it will fit. I see that the point (0, 144) is on the graph, so I’ll adjust the window accordingly:
Almost, but not quite. Looks like I need to widen the window:
Adjusting the Scale
If the graph appears too compressed or stretched, you can also adjust the scale of the axes from the “Window” menu. Use the “Xscl” and “Yscl” settings to change the spacing between tick marks on the x and y-axes, respectively. Notice that I actually changed the Yscl from the default 1 to 10 in the previous example; otherwise, the tick marks would have been too close together, and the graph would have looked like this:
Utilizing Zoom Options
You can also zoom in or out on the graph using predefined zoom settings. The “Zoom In” and “Zoom Out” options allow you to select a central point to zoom in or out from using the arrow keys. You can return the window to its default settings by choosing “Zoom Standard,” and your calculator will try (but, in my experience, often fail) to fit the function in the window if you select “Zoom Fit.” I prefer to manually adjust the window, but if I’m really stuck, choosing “Zoom Fit” and looking at the range of x and y values in the Window gives me a better idea of how to adjust the Window values.
Utilizing the Table Feature
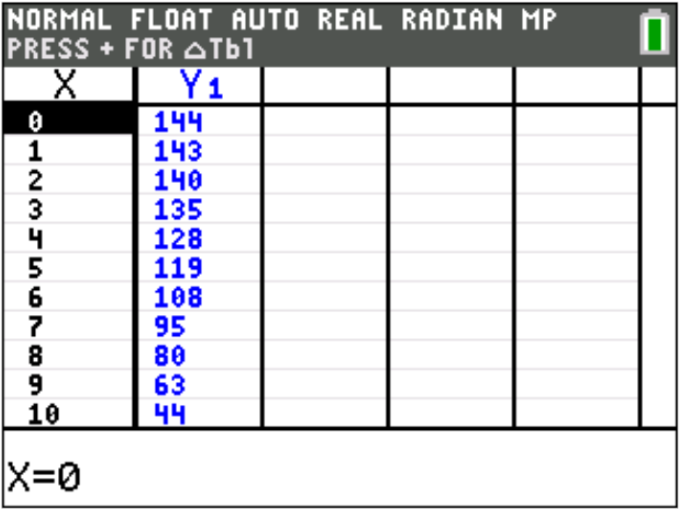
If we’re looking to find many points on the graph of a function, calculating each of them (using 2ND→CALC→1: value) can be time consuming and tedious. A Table will allow us to do this much more efficiently and can be accessed by entering a function in “Y=”, then pressing 2ND→GRAPH. Here’s the default table view for the function I graphed above
Adjusting Table Settings
The table displays the x- and y- values of the function for a range of x-values determined by the window settings. Use the arrow keys to navigate through the table. In this example, I might want to know some of the values of the function for x-values not provided in the table, so I press 2ND→WINDOW (TBLSET) to access the Table Settings menu. Here, you can adjust the increment (ΔTbl) and the starting value (TblStart). You can also tell the calculator to generate x- and y-values automatically based on the given ΔTbl (Indpnt: Auto and Depend: Auto) or if you will input values of either (Indpnt: Ask and Depend: Ask). Here are the settings I used to find values of the function at a handful of specific x-values:
SAT and ACT Applications
- Both tests include questions that require understanding and interpreting graphs of functions. Being able to adjust the window settings ensures that you can accurately visualize the function within the relevant domain and range, helping you answer questions about intercepts, maxima, minima, and behavior of the function.
- Understanding how shifts, stretches, and compressions affect the graph of a function can help in solving problems related to function transformations. Adjusting the window helps you see these changes clearly.
- The table feature allows you to generate specific values for a function, which can be helpful for verifying solutions or checking patterns. For example, you might use the table to find specific function values required to answer a problem.
Tips for Efficient Use During Tests:
- Familiarity: Spend time practicing with your calculator before the test so you can quickly adjust settings and interpret results without hesitation.
- Pre-set Windows: For common function types (quadratics, linear functions, etc.), have typical window ranges in mind that you can quickly input.
- Increment Settings: Choose appropriate increments for the table to ensure you get a comprehensive view of function values without excessive scrolling
Conclusion
By mastering the window manipulation and Table features of your TI-series graphing calculator, you can gain deeper insights into mathematical functions and streamline your problem-solving process in the Math sections of the SAT and ACT. Experiment with these tools to unlock the full potential of your calculator and add to your problem solving options, but these are just a few of the strategies you can learn as you prepare for the SAT or ACT with an expert Mindfish tutor. For more information, contact Mindfish today!
Interested in learning more about Test Prep at Mindfish?
Contact us today to find out what our dedicated tutors can help you achieve.


