

If your student is working on test preparation with a Mindfish tutor, they will likely be taking several practice tests through Mindfish as well. Through your student’s Online Score Tracker log-in, you can see their practice test scores by clicking on the “Scores” tab. Then, you can click on the individual tests to see a detailed score report. Your student’s tutor is trained to analyze these score reports and can provide insights into your student’s performance and progress, but I’d like to provide a comprehensive guide for interpreting these score reports with your student.
In this blog, I will walk through a score report of an actual student of mine, describe how I analyze these reports, and explain the trends that I see in this student’s report.
Reading the Score Report
1. Overall Score
At the top of the score report, as seen in Image 1, you can see your student’s overall score out of 1600. This is probably the most familiar part of the score report – you and your student likely have a goal in mind. This is a good number to keep track of, but it doesn’t tell us where to focus our efforts.
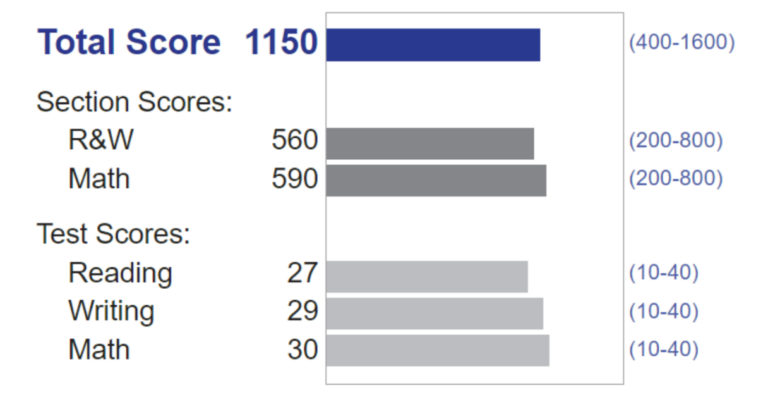
Image 1. The total score, section scores, and test scores of a Mindfish practice SAT.
2. Section Scores
Next, also in Image 1, you’ll see the Math and the Reading & Writing scores, each out of 800. These scores out of 800 are calculated using the Test Scores from reading, writing, and math found directly below the section scores. Each of the three subjects is scored out of 40. The total math section score is found by doubling the math test score and multiplying it by 10. In this case, the student received a 30 on the math test, and a 590 on the math section. This is likely because the student’s score out of 40 was actually 29.5 (29.5 x 2 x 10 = 590). For the R&W score, the reading and writing test scores are added (27 + 29 = 56) and multiplied by 10 (56 x 10 = 560).
The test scores out of 40 are based on the test’s score scale, which changes based on the test. Click here to learn how these scores are determined in more detail. For more information about why different tests have different score scales, check out this blog post.
3. Score History Tracking
Mindfish score reports include a visualization of the student’s score history in each section of the test, as shown in Image 2. Since this was this student’s first practice test, there is only one test listed. Image 3 shows the student’s score history after several practice tests, allowing us to track improvements and struggles in all sections, not just the overall score.
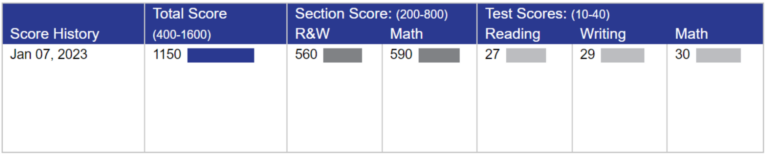
Image 2. Score history section of the test report. This was this student’s first practice test.
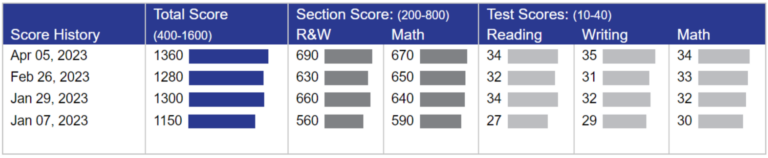
Image 3. Score history section of the student’s 4th practice test report.
4. Question accuracy
The next section of the score report shows us exactly which questions this student missed on the test. This is where we look for issues with strategies like timing. In the reading and writing sections of the test, the student guessed “C” for approximately 15 questions at the end of the section, indicating a struggle with timing in these sections. Otherwise, the student has quite good accuracy in both sections, though certain passages in the reading section may be harder than others. Reading passages are typically 9-11 questions, which tells us that this student struggled with the first and possibly second passages more than the third passage, but then likely ran out of time. Looking at the actual test packet would tell us which passages were harder (1 & 2) and which were easier (3).
In the math sections of this test, the student had good accuracy for a lot of the multiple-choice questions, though they did better with the calculator section than the non-calculator section (the shorter section is non-calculator, the longer is calculator). At the end of each section, there are grid-in (open-ended) questions, which this student struggled with. Seeing the blank answers and the series of zeros tells me that this student may have struggled with timing in math as well.
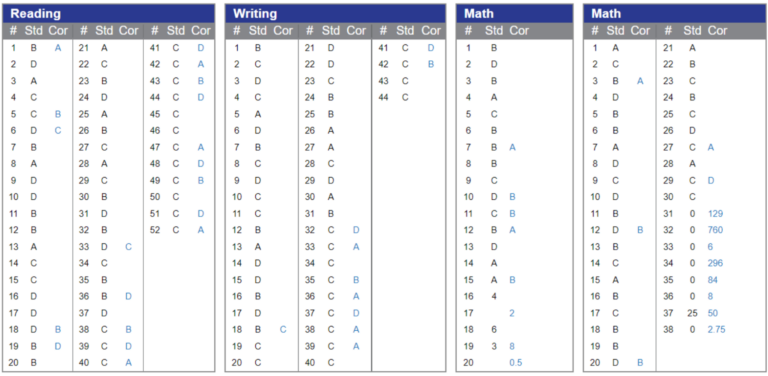
Image 4. Question accuracy from the student’s first score report (score of 1150).
5. Test Question Breakdown
This is where we can zero in on topics to work on. We’ll start with the reading section.
Keeping in mind that this student started guessing at question 38 in the reading section, I am only going to consider the questions they missed before that point. In Image 5, I’ve highlighted the missed questions before question 38. Looking at the highlighted questions, it looks like the student does well with finding specific details in passages and vocabulary questions but may have more trouble with author intent and inference questions. Since all the comparison passage questions were skipped by the student, I’m not sure how this student will do with the comparison questions. From this analysis, I may choose to focus on timing and inferences with the student, then review again after another practice test.
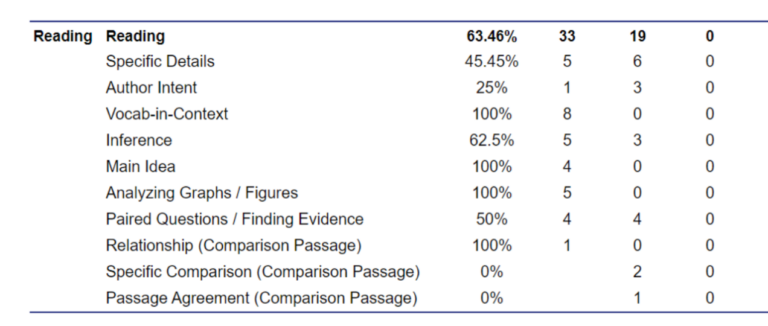
Image 5.
In the writing section, the student started guessing at question 32, so I again highlighted only the questions before that point. In Image 6, we can see that in the first 31 questions, the student only missed one question. The student also missed one punctuation question and its number is 2.32, so we know it’s the 32nd question in the section. Since the student started guessing around here, I can’t be sure whether the student answered or guessed on that question. For parallelism questions, however, the student didn’t get any correct – there was only one parallelism question, and it occurred after the student started guessing. So, we can’t decide with any certainty how well the student understands parallelism questions.
Based on this score report, I would likely focus on timing in the writing section, then review again after another practice test. It’s possible that speeding up in the section will decrease accuracy and highlight weaker areas.
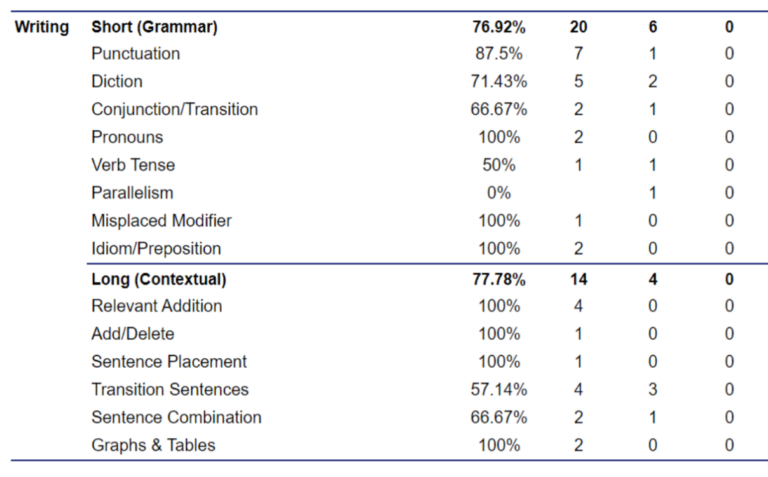
Image 6.
For the math section, I again omitted questions that the student omitted or guessed “0” on. Looking at this score report, I can see a distinct weakness in quadratics and additional weaknesses in single variable isolation, coordinate geometry, and ratios & proportions. So, in addition to working on timing and math strategies with this student, I would also spend some time working on those individual topics.
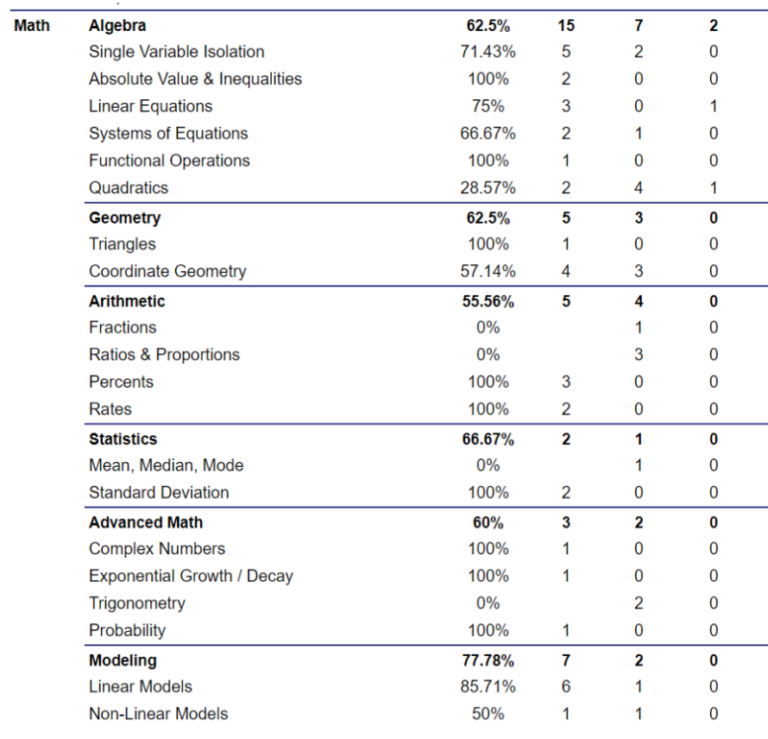
Image 7.
Next Steps Once You Understand the Report
There are many ways to help your student after reading the score report. Of course, your student’s tutor will use the score report to dictate strategies and concepts to focus on moving forward, but I want to provide some options for how to support your student at home as well.
- Give praise for the successes on the score report.
- Help organize notecards and encourage practice.
- Emphasize the potential shown in the report.
- Help develop a question list for the tutor.
- Ask the tutor how you can support studying at home.
Jamie O’Brien
Interested in learning more about Test Prep at Mindfish?
Contact us today to find out what our dedicated tutors can help you achieve.